Table of Contents
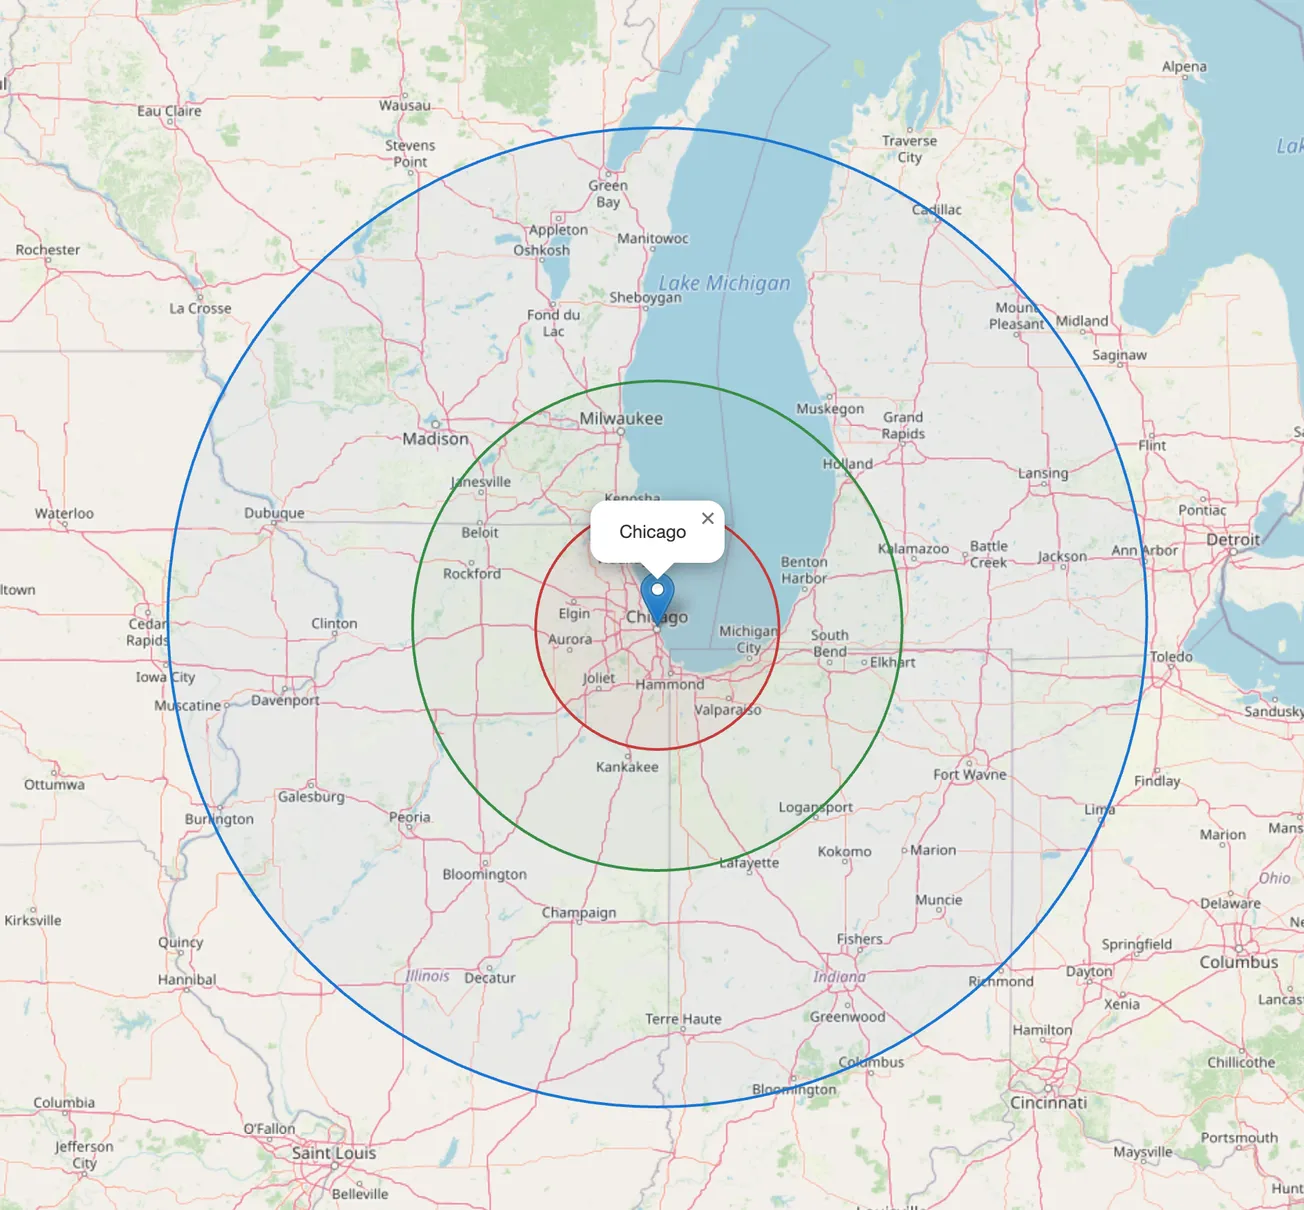
Do It Yourself Bullseye Maps
Bullseye maps are useful for orientation at the regional level. These are easy to assemble through the facilities of the Open Maps Project using the Leaflet API. Most of what this function does is to output HTML code with Javascript, which does the work. The HTML output is panable and zoomable. To create your own, just specify the city to center and the coordinates.
using Printf

"""
    dms_to_decimal(coords::AbstractString) -> String

Converts DMS (Degrees, Minutes, Seconds) or decimal format to decimal degrees.
Handles various symbols: °, ′, ', ″, '', ".
"""
function dms_to_decimal(coord::AbstractString)
    # 1. Clean up and check if it's already decimal (e.g., "41.8, -87.6")
    # This regex is now more flexible with spaces and signs
    clean_coord = replace(coord, " " => "")
    if occursin(r"^-?\d+(\.\d+)?,-?\d+(\.\d+)?$", clean_coord)
        parts = split(clean_coord, ",")
        return "$(parts[1]), $(parts[2])"
    end

    # 2. Handle DMS format
    parts = split(coord, ",")
    if length(parts) != 2
        throw(ArgumentError("Expected 'Lat, Lon' format. Received: $coord"))
    end

    lat_dms = strip(parts[1])
    lon_dms = strip(parts[2])

    function to_decimal(dms::AbstractString)
        # Normalize symbols
        dms = replace(dms, "''" => "″", "\"" => "″", "'" => "′")

        # Match components: Degrees, Minutes, Seconds, and Direction
        # Added 'i' for case-insensitive NSEW
        m = match(r"(\d+)\s*°?\s*(\d+)\s*′?\s*(\d+(?:\.\d+)?)\s*″?\s*([NSEW])"i, dms)

        if m === nothing
            throw(ArgumentError("Invalid DMS format: $dms"))
        end

        deg = parse(Float64, m.captures[1])
        min = parse(Float64, m.captures[2])
        sec = parse(Float64, m.captures[3])
        dir = uppercase(m.captures[4])

        decimal = deg + (min / 60) + (sec / 3600)
        if dir == "S" || dir == "W"
            decimal *= -1
        end
        return decimal
    end

    return "$(to_decimal(lat_dms)), $(to_decimal(lon_dms))"
end

"""
    create_bullseye_map(capital_name, capital_coords; file_path, bands, color_scheme)

Creates a Leaflet HTML map with auto-calculating zoom and distance bands.
"""
function create_bullseye_map(capital_name::String, capital_coords::String,
    file_path::String="bullseye.html",
    bands::String="50, 100, 200",
    color_scheme::Int=4)

    # Color Palettes
    pal = (
        "'Red', 'Green', 'Yellow', 'Blue', 'Purple'",
        "'#E74C3C', '#2ECC71', '#3498DB', '#F1C40F', '#9B59B6'",
        "'#FF4136', '#2ECC40', '#0074D9', '#FFDC00', '#B10DC9'",
        "'#D32F2F', '#388E3C', '#1976D2', '#FBC02D', '#7B1FA2'",
        "'#FF5733', '#C70039', '#900C3F', '#581845', '#FFC300'"
    )

    # 1. Coordinate Conversion
    centerpoint = dms_to_decimal(capital_coords)
    band_colors = pal[color_scheme]

    # 2. Auto-Zoom Calculation
    # Formula: 12 - log2(distance). Clamp between 1 (world) and 18 (street).
    band_vals = parse.(Float64, split(bands, ","))
    max_dist = maximum(band_vals)
    auto_zoom = clamp(floor(Int, 12 - log2(max_dist)), 1, 18)

    # 3. HTML Template
    bullseye_html = """
    <!DOCTYPE html>
    <html>
    <head>
      <title>Bullseye Map - $capital_name</title>
      <link rel="stylesheet" href="https://unpkg.com/leaflet@1.9.4/dist/leaflet.css" />
      <script src="https://unpkg.com/leaflet@1.9.4/dist/leaflet.js"></script>
      <style>
        body, html { margin: 0; padding: 0; width: 100%; height: 100%; }
        #map { width: 100%; height: 100vh; }
        .legend {
            padding: 10px; background: white; border-radius: 5px;
            box-shadow: 0 0 15px rgba(0,0,0,0.2); line-height: 1.5;
            font-family: sans-serif;
        }
        .legend i { width: 18px; height: 18px; float: left; margin-right: 8px; opacity: 0.7; }
      </style>
    </head>
    <body>
    <div id="map"></div>
    <script>
    var map = L.map('map').setView([$centerpoint], $auto_zoom);

    L.tileLayer('https://{s}.tile.openstreetmap.org/{z}/{x}/{y}.png', {
        attribution: '© OpenStreetMap contributors'
    }).addTo(map);

    L.marker([$centerpoint]).addTo(map)
        .bindPopup('<b>$capital_name</b><br>Centerpoint')
        .openPopup();

    var colors = [$band_colors];
    var radii = [$bands];

    radii.forEach(function(radius, index) {
        L.circle([$centerpoint], {
            radius: radius * 1609.34, // Convert Miles to Meters
            color: colors[index % colors.length],
            weight: 2,
            fillColor: colors[index % colors.length],
            fillOpacity: 0.1,
            interactive: false
        }).addTo(map);
    });

    var legend = L.control({position: 'bottomleft'});
    legend.onAdd = function (map) {
        var div = L.DomUtil.create('div', 'legend');
        div.innerHTML = '<strong>Distance (Miles)</strong><br>';
        radii.forEach(function(radius, i) {
            div.innerHTML += '<i style="background:' + colors[i % colors.length] + '"></i> ' + radius + ' mi<br>';
        });
        return div;
    };
    legend.addTo(map);

    window.addEventListener('resize', function() { map.invalidateSize(); });
    </script>
    </body>
    </html>
    """

    open(file_path, "w") do f
        write(f, bullseye_html)
    end

    println("Map generated successfully: \$file_path (Zoom Level: \$auto_zoom)")
    return file_path
end

# Execution
create_bullseye_map("Chicago", "41° 52' 54.5952'' N, 87° 37' 23.4372'' W")
Latest
Excel to Julia: The Rosetta Stone
For when your spreadsheet starts to crawl, but you still need to get the job done. 1. The Basics: Data as a Thing In Excel, the data and the logic live in the same cell. In Julia, we keep them separate for speed and sanity. * Workbook/Sheet ≅ DataFrame * Column ≅:Symbol
Using the forum at Julialang.org
The Julia language organization maintains an open, free forum where you can post questions to the helpful users under the New to Julia category. Especially if your question involves advanced scientific capabilities of the language, such as tensors, it will be invaluable. On the other hand … If you are an
Age pyramids
The age pyramid is a useful tool in demographic analysis. It visualizes the relative proportion of population by sex and age cohort. The shape of the curve can indicate an excess of deaths over births and give an idea of the sufficiency of the working age population to support the
Up and running on the command line interface
A five-minute liftoff. Get your copy of the cheatsheet at https://JuliaMapping.com/cli_macos_cheatsheet.pdf Learn more Become a member Subscribe: free or paid